ノート
完全なサンプルコードをダウンロードするには、ここをクリックしてください
Matplotlib プロットのテキスト#
Matplotlib でのテキストのプロットと操作の概要。
Matplotlib には、数式のサポート、ラスターおよびベクター出力の TrueType サポート、任意の回転による改行区切りテキスト、Unicode サポートなど、広範なテキスト サポートがあります。
Postscript や PDF などの出力ドキュメントにフォントを直接埋め込むため、画面に表示されるものがハードコピーに表示されます。
FreeTypeのサポートにより、小さなラスター サイズでもきれいに見える、非常に優れたアンチエイリアス処理されたフォントが生成されます。Matplotlib には、クロスプラットフォームのW3C
準拠のフォント検索アルゴリズムを実装する独自の
matplotlib.font_manager(Paul Barrett のおかげで) が含まれています。
ユーザーは、テキストのプロパティ (フォント サイズ、フォントの太さ、テキストの位置、色など) を大幅に制御できます。適切なデフォルトはrc ファイルに設定されています。そして重要なことに、数学や科学の図に興味がある人のために、Matplotlib は多数の TeX 数学記号とコマンドを実装しており、図のどこでも数式をサポートしています。
基本的なテキストコマンド#
次のコマンドは、暗黙的および明示的なインターフェイスでテキストを作成するために使用されます (トレードオフの説明については、Matplotlib アプリケーション インターフェイス (API)を参照してください)。
暗黙の API |
明示的な API |
説明 |
|---|---|---|
の任意の場所にテキストを追加します |
||
の任意の場所に、オプションの矢印を使用して注釈を追加し
|
||
|
||
|
||
にタイトルを追加し
|
||
の任意の場所にテキストを追加します |
||
にタイトルを追加し |
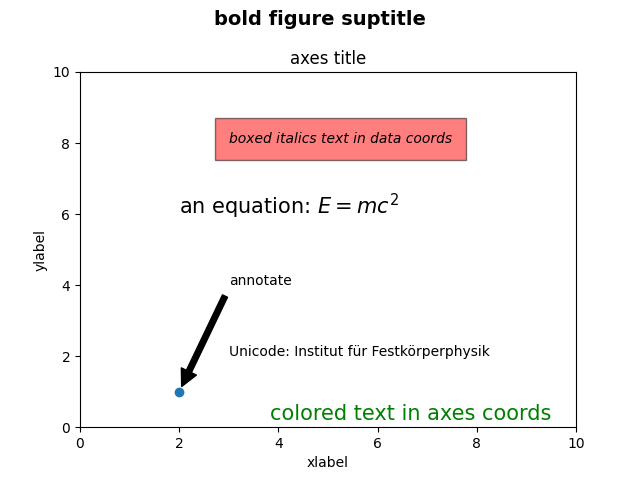
これらの関数はすべてText、さまざまなフォントやその他のプロパティで構成できるインスタンスを作成して返します。以下の例は、これらすべてのコマンドの動作を示しています。詳細については、以降のセクションで説明します。
import matplotlib
import matplotlib.pyplot as plt

fig = plt.figure()
ax = fig.add_subplot()
fig.subplots_adjust(top=0.85)

# Set titles for the figure and the subplot respectively
fig.suptitle('bold figure suptitle', fontsize=14, fontweight='bold')
ax.set_title('axes title')

ax.set_xlabel('xlabel')
ax.set_ylabel('ylabel')

# Set both x- and y-axis limits to [0, 10] instead of default [0, 1]
ax.axis([0, 10, 0, 10])

ax.text(3, 8, 'boxed italics text in data coords', style='italic',
        bbox={'facecolor': 'red', 'alpha': 0.5, 'pad': 10})

ax.text(2, 6, r'an equation: $E=mc^2$', fontsize=15)

ax.text(3, 2, 'Unicode: Institut für Festkörperphysik')

ax.text(0.95, 0.01, 'colored text in axes coords',
        verticalalignment='bottom', horizontalalignment='right',
        transform=ax.transAxes,
        color='green', fontsize=15)

ax.plot([2], [1], 'o')
ax.annotate('annotate', xy=(2, 1), xytext=(3, 4),
            arrowprops=dict(facecolor='black', shrink=0.05))

plt.show()
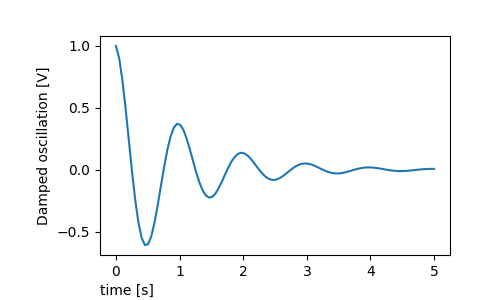
x 軸と y 軸のラベル#
x 軸と y 軸のラベルの指定は
、 メソッドset_xlabelとset_ylabel
メソッドを使用して簡単に行うことができます。
import matplotlib.pyplot as plt
import numpy as np

x1 = np.linspace(0.0, 5.0, 100)
y1 = np.cos(2 * np.pi * x1) * np.exp(-x1)

fig, ax = plt.subplots(figsize=(5, 3))
fig.subplots_adjust(bottom=0.15, left=0.2)
ax.plot(x1, y1)
ax.set_xlabel('time [s]')
ax.set_ylabel('Damped oscillation [V]')

plt.show()
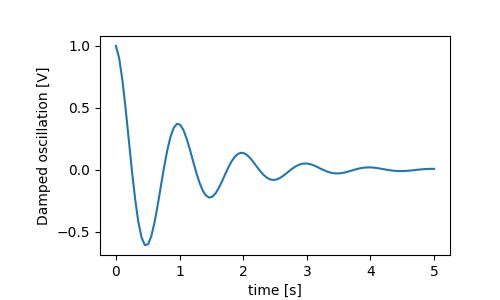
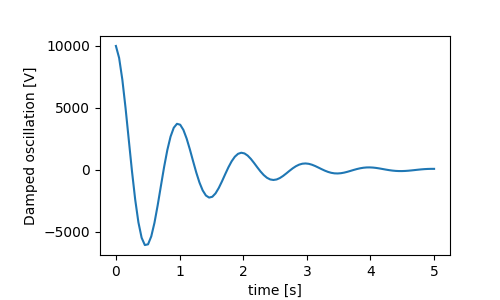
x および y ラベルは、x および y の目盛りラベルをクリアするように自動的に配置されます。下のプロットを上のプロットと比較し、y ラベルが上のプロットの左側にあることに注意してください。
fig, ax = plt.subplots(figsize=(5, 3))
fig.subplots_adjust(bottom=0.15, left=0.2)
ax.plot(x1, y1*10000)
ax.set_xlabel('time [s]')
ax.set_ylabel('Damped oscillation [V]')

plt.show()
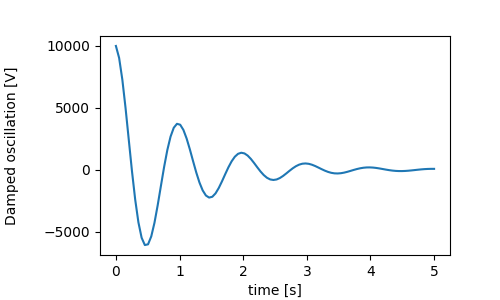
ラベルを移動したい場合は、labelpadキーワード引数を指定できます。値はポイント (1/72 インチ、フォントサイズの指定に使用される単位と同じ) です。
fig, ax = plt.subplots(figsize=(5, 3))
fig.subplots_adjust(bottom=0.15, left=0.2)
ax.plot(x1, y1*10000)
ax.set_xlabel('time [s]')
ax.set_ylabel('Damped oscillation [V]', labelpad=18)

plt.show()
または、ラベルはpositionTextを含むすべてのキーワード引数
を受け入れます。これにより、ラベルの位置を手動で指定できます。ここでは、軸の左端に xlabel を配置します。この位置の y 座標は効果がないことに注意してください。y 位置を調整するには、
labelpadキーワード引数を使用する必要があります。
fig, ax = plt.subplots(figsize=(5, 3))
fig.subplots_adjust(bottom=0.15, left=0.2)
ax.plot(x1, y1)
ax.set_xlabel('time [s]', position=(0., 1e6), horizontalalignment='left')
ax.set_ylabel('Damped oscillation [V]')

plt.show()
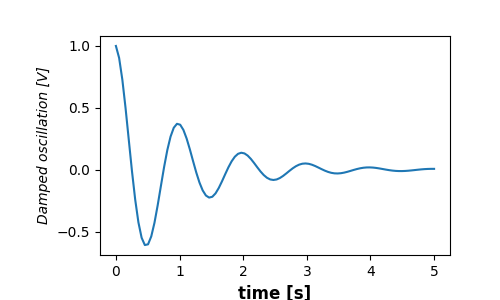
matplotlib.font_manager.FontPropertiesこのチュートリアルのすべてのラベル付けは、メソッドを操作するか、名前付きのキーワード引数を使用して変更できます
set_xlabel
from matplotlib.font_manager import FontProperties

font = FontProperties()
font.set_family('serif')
font.set_name('Times New Roman')
font.set_style('italic')

fig, ax = plt.subplots(figsize=(5, 3))
fig.subplots_adjust(bottom=0.15, left=0.2)
ax.plot(x1, y1)
ax.set_xlabel('time [s]', fontsize='large', fontweight='bold')
ax.set_ylabel('Damped oscillation [V]', fontproperties=font)

plt.show()
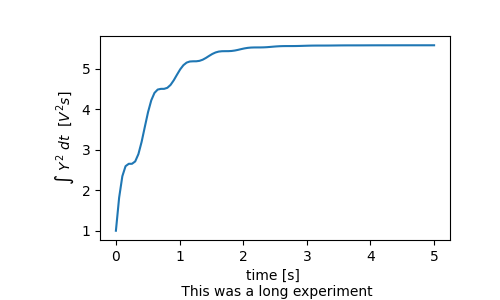
最後に、すべてのテキスト オブジェクトでネイティブ TeX レンダリングを使用し、複数の行を含めることができます。
fig, ax = plt.subplots(figsize=(5, 3))
fig.subplots_adjust(bottom=0.2, left=0.2)
ax.plot(x1, np.cumsum(y1**2))
ax.set_xlabel('time [s] \n This was a long experiment')
ax.set_ylabel(r'$\int\ Y^2\ dt\ \ [V^2 s]$')
plt.show()
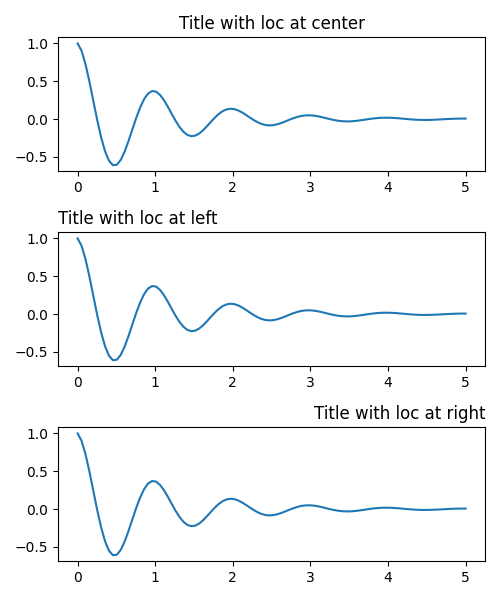
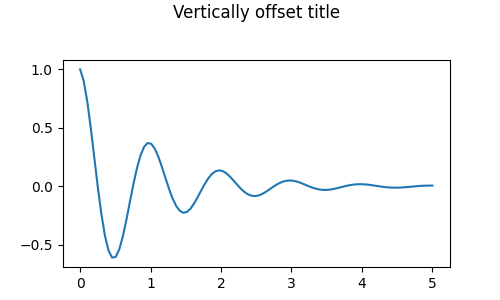
タイトル#
サブプロットのタイトルは、ラベルとほぼ同じ方法で設定されますが、位置と配置を のデフォルト値から変更できるlocloc=centerキーワード引数があります。
タイトルの垂直方向の間隔はrcParams["axes.titlepad"](デフォルト: 6.0) で制御されます。別の値に設定すると、タイトルが移動します。
fig, ax = plt.subplots(figsize=(5, 3))
fig.subplots_adjust(top=0.8)
ax.plot(x1, y1)
ax.set_title('Vertically offset title', pad=30)
plt.show()
目盛りと目盛りラベル#
目盛りと目盛りラベルの配置は、図を作成する上で非常にトリッキーな側面です。Matplotlib は、タスクを自動的に実行するために最善を尽くしますが、目盛りの位置の選択とラベル付け方法を決定するための非常に柔軟なフレームワークも提供します。
用語#
軸には と のmatplotlib.axis.Axisオブジェクトがありax.xaxis、
ax.yaxis軸内のラベルのレイアウト方法に関する情報が含まれています。
軸 API については、ドキュメントで詳しく説明されています
axis。
Axis オブジェクトには主目盛りと副目盛りがあります。軸には
、プロットされているデータを使用して主目盛りと副目盛りの位置を決定するメソッドがAxis.set_major_locatorあります。目盛りラベルをフォーマットするおよびメソッドAxis.set_minor_locatorもあります。Axis.set_major_formatterAxis.set_minor_formatter
シンプルティック#
デフォルトのロケーターとフォーマッターをオーバーライドして、目盛り値を定義し、場合によっては目盛りラベルを単純に定義すると便利なことがよくあります。これは、プロットのインタラクティブなナビゲーションを中断するため、お勧めできません。また、軸の制限をリセットすることもできます。2 番目のプロットには、自動表示制限の外側にあるものを含め、要求した目盛りがあることに注意してください。
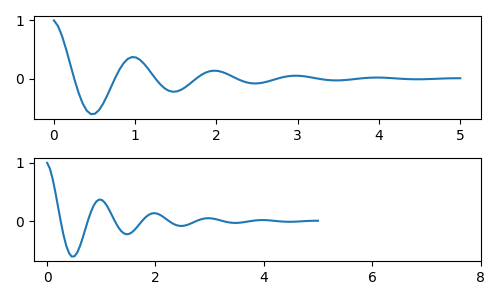
もちろん、これは事後に修正できますが、ティックをハードコーディングすることの弱点が浮き彫りになります。この例では、目盛りの形式も変更します。
fig, axs = plt.subplots(2, 1, figsize=(5, 3), tight_layout=True)
axs[0].plot(x1, y1)
axs[1].plot(x1, y1)
ticks = np.arange(0., 8.1, 2.)
# list comprehension to get all tick labels...
tickla = [f'{tick:1.2f}' for tick in ticks]
axs[1].xaxis.set_ticks(ticks)
axs[1].xaxis.set_ticklabels(tickla)
axs[1].set_xlim(axs[0].get_xlim())
plt.show()

ティックロケーターとフォーマッター#
すべての目盛りラベルのリストを作成する代わりに、matplotlib.ticker.StrMethodFormatter(新しいスタイルのstr.format()
書式文字列) またはmatplotlib.ticker.FormatStrFormatter(古いスタイルの '%' 書式文字列) を使用して、ax.xaxis. フォーマッタを明示的に作成しなくてもmatplotlib.ticker.StrMethodFormatter、 a を渡すことで を作成することもでき
ます
。str
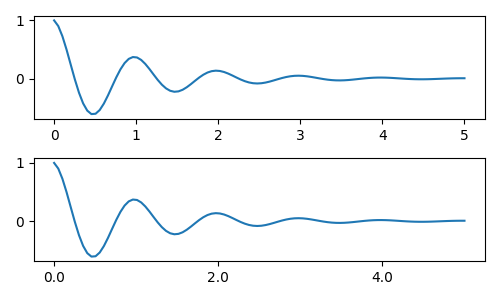
もちろん、デフォルト以外のロケーターを使用して目盛りの位置を設定することもできます。引き続きティック値を渡しますが、上記で使用した x-limit 修正は必要ないことに注意してください。
デフォルトのフォーマッタは次のように
呼び出さmatplotlib.ticker.MaxNLocatorれ
ます。steps キーワードには、目盛り値に使用できる倍数のリストが含まれています。つまり、この場合、20、40、60 または 0.2、0.4、0.6 と同様に、2、4、6 が許容可能なティックになります。ただし、3、6、9 はステップのリストに表示されないため、受け入れられません。ticker.MaxNLocator(self, nbins='auto', steps=[1, 2, 2.5, 5, 10])
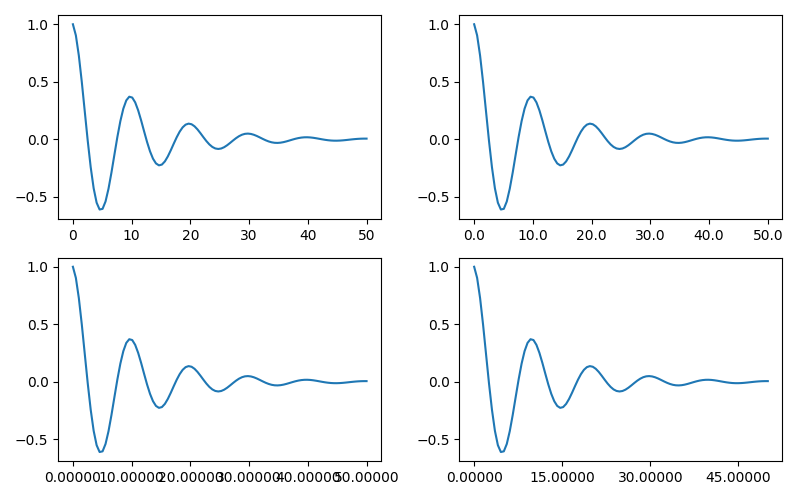
nbins=autoアルゴリズムを使用して、軸の長さに基づいて許容される目盛りの数を決定します。目盛りラベルのフォントサイズは考慮されますが、目盛り文字列の長さは考慮されません (まだ知られていないため)。下の行では、目盛りラベルが非常に大きいnbins=4ため、ラベルが右側に収まるように設定します。手のプロット。
fig, axs = plt.subplots(2, 2, figsize=(8, 5), tight_layout=True)
for n, ax in enumerate(axs.flat):
    ax.plot(x1*10., y1)

formatter = matplotlib.ticker.FormatStrFormatter('%1.1f')
locator = matplotlib.ticker.MaxNLocator(nbins='auto', steps=[1, 4, 10])
axs[0, 1].xaxis.set_major_locator(locator)
axs[0, 1].xaxis.set_major_formatter(formatter)

formatter = matplotlib.ticker.FormatStrFormatter('%1.5f')
locator = matplotlib.ticker.AutoLocator()
axs[1, 0].xaxis.set_major_formatter(formatter)
axs[1, 0].xaxis.set_major_locator(locator)

formatter = matplotlib.ticker.FormatStrFormatter('%1.5f')
locator = matplotlib.ticker.MaxNLocator(nbins=4)
axs[1, 1].xaxis.set_major_formatter(formatter)
axs[1, 1].xaxis.set_major_locator(locator)

plt.show()
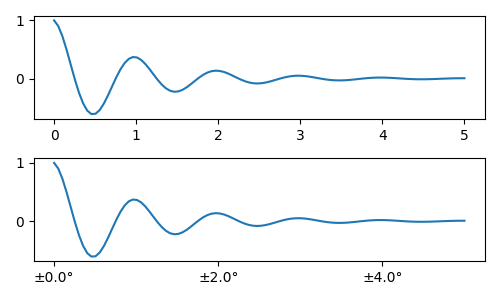
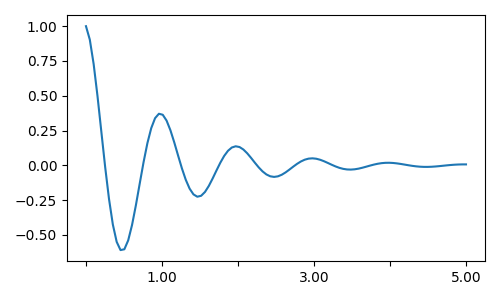
最後に、 を使用してフォーマッタの関数を指定できます
matplotlib.ticker.FuncFormatter。さらに、 のよう
matplotlib.ticker.StrMethodFormatterに、関数を渡すと自動的に が作成されますmatplotlib.ticker.FuncFormatter。
def formatoddticks(x, pos):
    """Format odd tick positions."""
    if x % 2:
        return f'{x:1.2f}'
    else:
        return ''


fig, ax = plt.subplots(figsize=(5, 3), tight_layout=True)
ax.plot(x1, y1)
locator = matplotlib.ticker.MaxNLocator(nbins=6)
ax.xaxis.set_major_formatter(formatoddticks)
ax.xaxis.set_major_locator(locator)

plt.show()
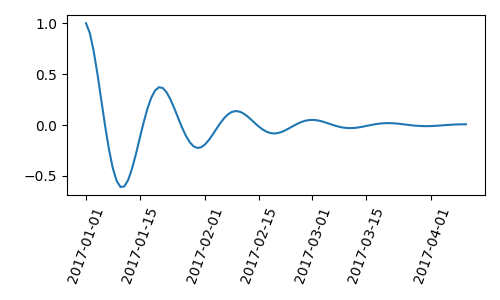
日付ティック#
Matplotlib は、datetime.datetimeおよびnumpy.datetime64
オブジェクトをプロット引数として受け入れることができます。日付と時刻には特別な書式設定が必要であり、多くの場合、手動で介入することでメリットが得られます。役立つように、日付にはmatplotlib.datesモジュールで定義された特別なロケーターとフォーマッターがあります。
簡単な例は次のとおりです。目盛りラベルが互いにオーバーランしないように、目盛りラベルをどのように回転させる必要があるかに注意してください。
import datetime

fig, ax = plt.subplots(figsize=(5, 3), tight_layout=True)
base = datetime.datetime(2017, 1, 1, 0, 0, 1)
time = [base + datetime.timedelta(days=x) for x in range(len(x1))]

ax.plot(time, y1)
ax.tick_params(axis='x', rotation=70)
plt.show()
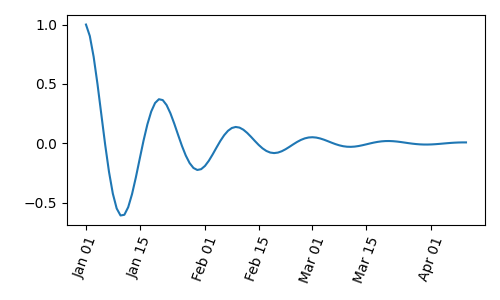
にフォーマットを渡すことができますmatplotlib.dates.DateFormatter。また、29 日と翌月が非常に近いことにも注意してください。クラスを使用してこれを修正できます。これにより、使用dates.DayLocatorする月の日のリストを指定できます。同様のフォーマッタがmatplotlib.dates
モジュールにリストされています。
import matplotlib.dates as mdates

locator = mdates.DayLocator(bymonthday=[1, 15])
formatter = mdates.DateFormatter('%b %d')

fig, ax = plt.subplots(figsize=(5, 3), tight_layout=True)
ax.xaxis.set_major_locator(locator)
ax.xaxis.set_major_formatter(formatter)
ax.plot(time, y1)
ax.tick_params(axis='x', rotation=70)
plt.show()
凡例と注釈#
スクリプトの合計実行時間: ( 0 分 5.998 秒)