ノート
完全なサンプルコードをダウンロードするには、ここをクリックしてください
複雑で意味のある図の構成#
警告
このチュートリアルでは、実験的 / 暫定的な API について説明します。ユーザーからのフィードバックを得るために、これを v3.3 でリリースします。将来のバージョンでは、予告なしに重大な変更を加える可能性があります。
Figure 内の Axes を不均一なグリッドに配置することは、退屈で冗長になる可能性があります。高密度で均一なグリッドFigure.subplotsの場合、レイアウトの複数の列/行にまたがる Axes や Figure の一部の領域を空白にする Axes などのより複雑なレイアウトの場合は、使用することができます
gridspec.GridSpec( Figure に複数の Axes を配置するを参照)。軸。Figure.subplot_mosaicこのプロセスを効率化するために、(ASCII アートまたはネストされたリストとして) 軸を視覚的にレイアウトするためのインターフェイスを提供することを目的としています。
このインターフェイスは、軸の命名を当然サポートします。
Figure.subplot_mosaicFigure のレイアウトに使用されるラベルをキーにした辞書を返します。名前を含むデータ構造を返すことにより、Figure のレイアウトに依存しないプロット コードを簡単に記述できます。
これは、提案された MEPと R の パッチワークライブラリに触発されています。演算子のオーバーロード スタイルを実装していませんが、(ネストされた) Axes レイアウトを指定するための Pythonic API を提供しています。
import matplotlib.pyplot as plt
import numpy as np


# Helper function used for visualization in the following examples
def identify_axes(ax_dict, fontsize=48):
    """
    Helper to identify the Axes in the examples below.

    Draws the label in a large font in the center of the Axes.

    Parameters
    ----------
    ax_dict : dict[str, Axes]
        Mapping between the title / label and the Axes.
    fontsize : int, optional
        How big the label should be.
    """
    kw = dict(ha="center", va="center", fontsize=fontsize, color="darkgrey")
    for k, ax in ax_dict.items():
        ax.text(0.5, 0.5, k, transform=ax.transAxes, **kw)
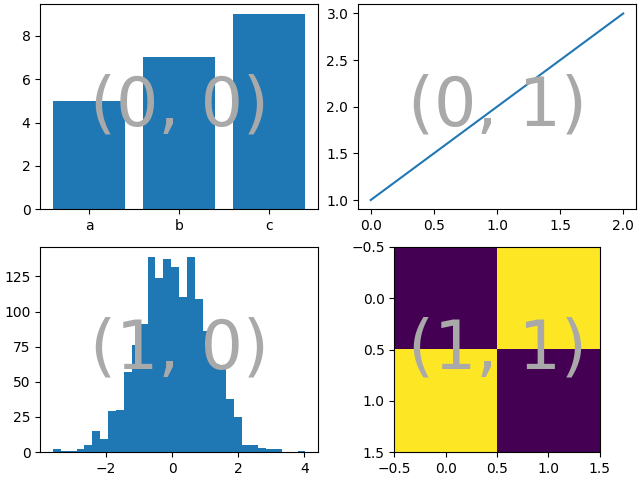
2x2 グリッドが必要な場合は、これを使用して、プロットを行うためにインデックスを作成できるFigure.subplots2D 配列を返します。axes.Axes
np.random.seed(19680801)
hist_data = np.random.randn(1_500)


fig = plt.figure(constrained_layout=True)
ax_array = fig.subplots(2, 2, squeeze=False)

ax_array[0, 0].bar(["a", "b", "c"], [5, 7, 9])
ax_array[0, 1].plot([1, 2, 3])
ax_array[1, 0].hist(hist_data, bins="auto")
ax_array[1, 1].imshow([[1, 2], [2, 1]])

identify_axes(
    {(j, k): a for j, r in enumerate(ax_array) for k, a in enumerate(r)},
)
を使用しFigure.subplot_mosaicて、同じモザイクを生成できますが、軸にセマンティック名を付けます
fig = plt.figure(constrained_layout=True)
ax_dict = fig.subplot_mosaic(
    [
        ["bar", "plot"],
        ["hist", "image"],
    ],
)
ax_dict["bar"].bar(["a", "b", "c"], [5, 7, 9])
ax_dict["plot"].plot([1, 2, 3])
ax_dict["hist"].hist(hist_data)
ax_dict["image"].imshow([[1, 2], [2, 1]])
identify_axes(ax_dict)
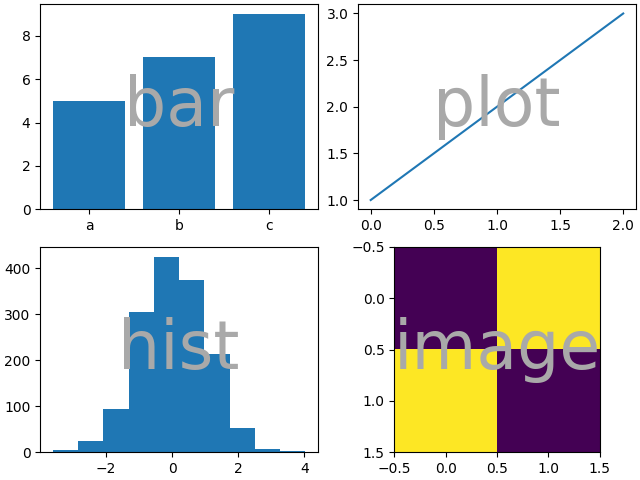
Figure.subplotsと
の主な違いFigure.subplot_mosaicは戻り値です。前者はインデックス アクセス用の配列を返しますが、後者はaxes.Axes作成されたインスタンスにラベルをマッピングする辞書を返します。
print(ax_dict)
{'bar': <AxesSubplot: label='bar'>, 'plot': <AxesSubplot: label='plot'>, 'hist': <AxesSubplot: label='hist'>, 'image': <AxesSubplot: label='image'>}
文字列の短縮形#
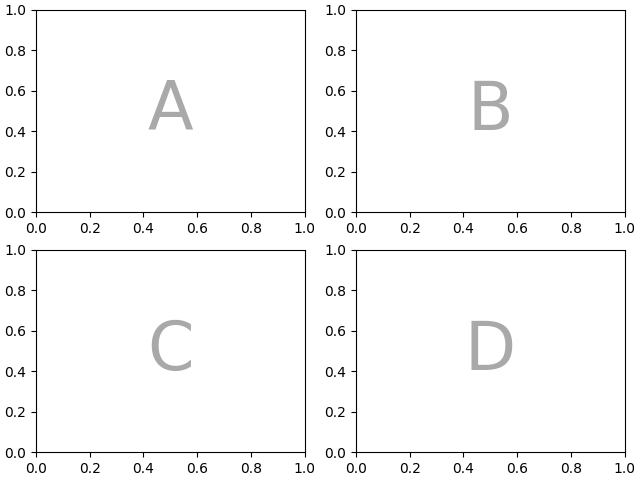
軸ラベルを単一の文字に制限することで、必要な軸を「ASCII アート」として「描画」できます。以下
mosaic = """
    AB
    CD
    """
は、2x2 グリッドに配置された 4 つの Axes を提供し、上記と同じ図形モザイクを生成します (ただし、ではなく でラベル付けされています)。{"A", "B", "C",
"D"}{"bar", "plot", "hist", "image"}
fig = plt.figure(constrained_layout=True)
ax_dict = fig.subplot_mosaic(mosaic)
identify_axes(ax_dict)
または、よりコンパクトな文字列表記を使用できます
mosaic = "AB;CD"
";"改行の代わりに行セパレーターとして使用される同じ構成が得られます。
fig = plt.figure(constrained_layout=True)
ax_dict = fig.subplot_mosaic(mosaic)
identify_axes(ax_dict)

複数の行/列にまたがる軸#
Axes が複数の行または列にまたがるように指定することはできFigure.subplot_mosaicますが、ユーザーにはできません。Figure.subplots
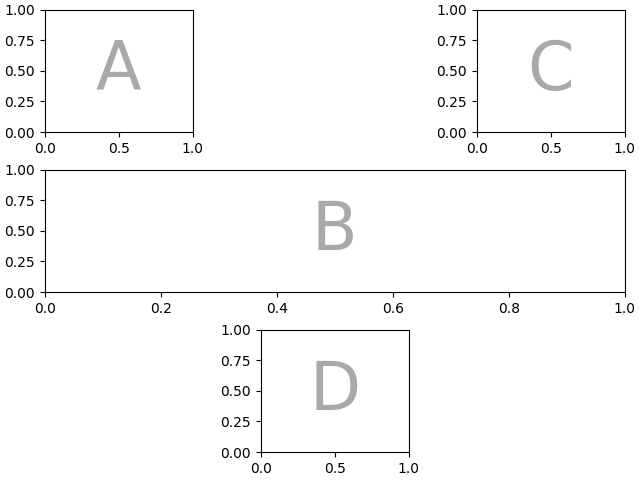
4 つの Axes を再配置して"C"、下部が水平スパンになり"D"、右側が垂直スパンになるようにするには、次のようにします。
axd = plt.figure(constrained_layout=True).subplot_mosaic(
    """
    ABD
    CCD
    """
)
identify_axes(axd)
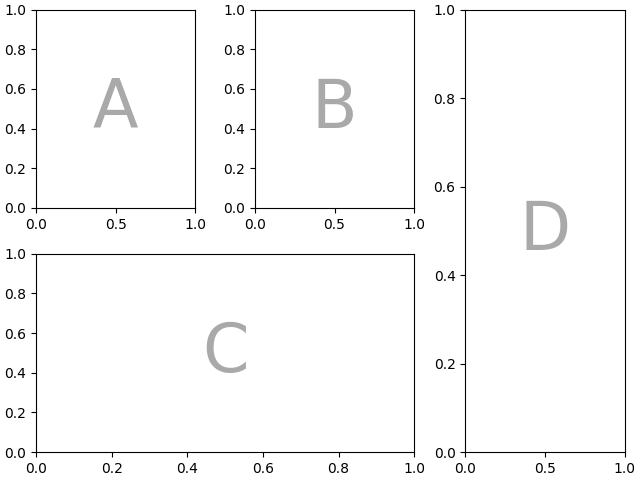
Figure 内のすべてのスペースを Axes で埋めたくない場合は、グリッド内の一部のスペースを空白に指定できます。
axd = plt.figure(constrained_layout=True).subplot_mosaic(
    """
    A.C
    BBB
    .D.
    """
)
identify_axes(axd)
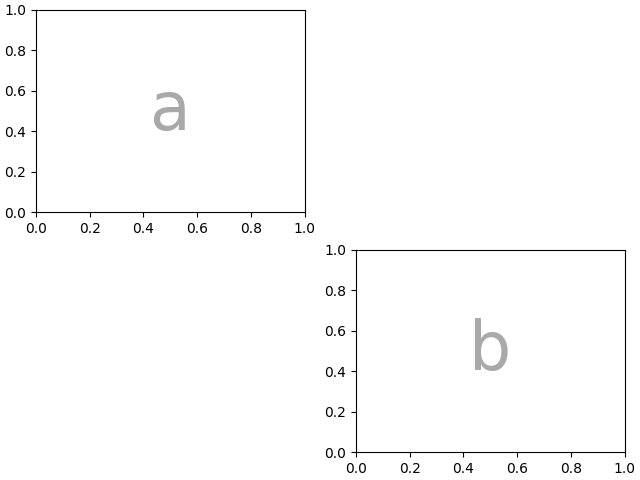
"."空のスペースをマークするために(ピリオドではなく) 別の文字を使用したい場合は、 empty_sentinelを使用して使用する文字を指定できます。
axd = plt.figure(constrained_layout=True).subplot_mosaic(
    """
    aX
    Xb
    """,
    empty_sentinel="X",
)
identify_axes(axd)
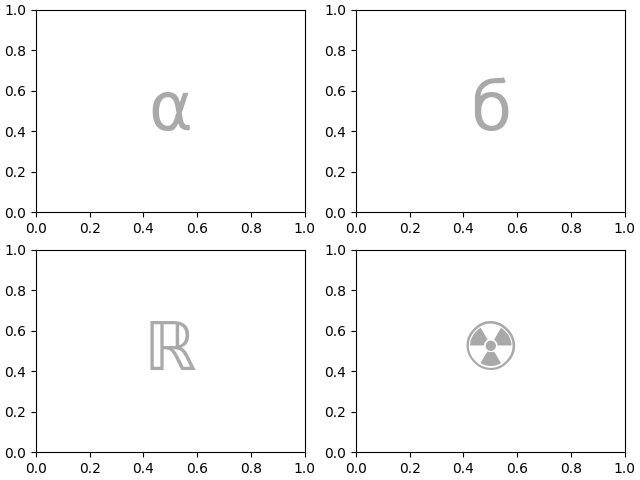
内部的には、使用する文字に意味はありません。どの Unicode コード ポイントも有効です。
axd = plt.figure(constrained_layout=True).subplot_mosaic(
    """αб
       ℝ☢"""
)
identify_axes(axd)
入力の処理中に空白が削除される可能性があるため、省略形の文字列でラベルまたは空の標識として空白を使用することはお勧めしません。
モザイクとサブプロットの作成を制御する#
この機能は の上に構築されてgridspecおり、キーワード引数を下層に渡すことができますgridspec.GridSpec
( と同じFigure.subplots)。
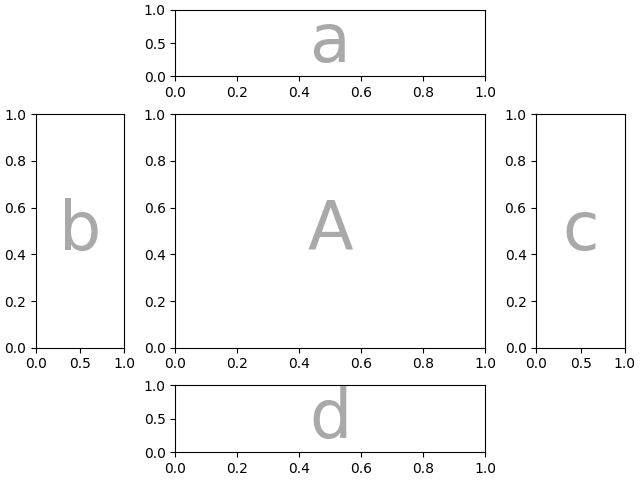
この場合、入力を使用して配置を指定しますが、行/列の相対的な幅はgridspec_kwで設定します。
axd = plt.figure(constrained_layout=True).subplot_mosaic(
    """
    .a.
    bAc
    .d.
    """,
    # set the height ratios between the rows
    height_ratios=[1, 3.5, 1],
    # set the width ratios between the columns
    width_ratios=[1, 3.5, 1],
)
identify_axes(axd)
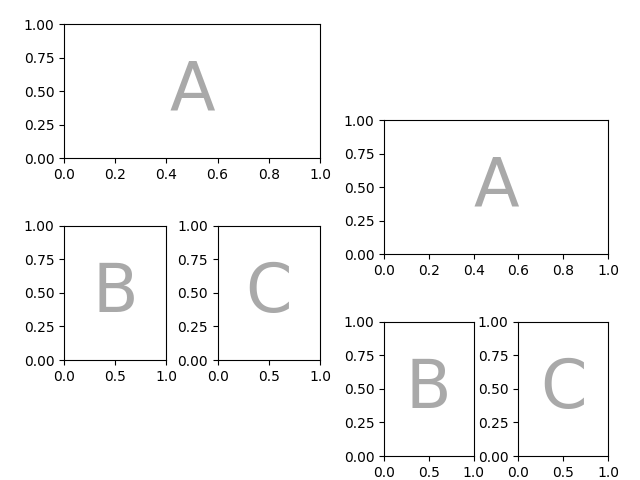
または、{ left , right , bottom , top } キーワード引数を使用してモザイク全体を配置し、同じモザイクの複数のバージョンを Figure に配置します。
mosaic = """AA
            BC"""
fig = plt.figure()
axd = fig.subplot_mosaic(
    mosaic,
    gridspec_kw={
        "bottom": 0.25,
        "top": 0.95,
        "left": 0.1,
        "right": 0.5,
        "wspace": 0.5,
        "hspace": 0.5,
    },
)
identify_axes(axd)

axd = fig.subplot_mosaic(
    mosaic,
    gridspec_kw={
        "bottom": 0.05,
        "top": 0.75,
        "left": 0.6,
        "right": 0.95,
        "wspace": 0.5,
        "hspace": 0.5,
    },
)
identify_axes(axd)
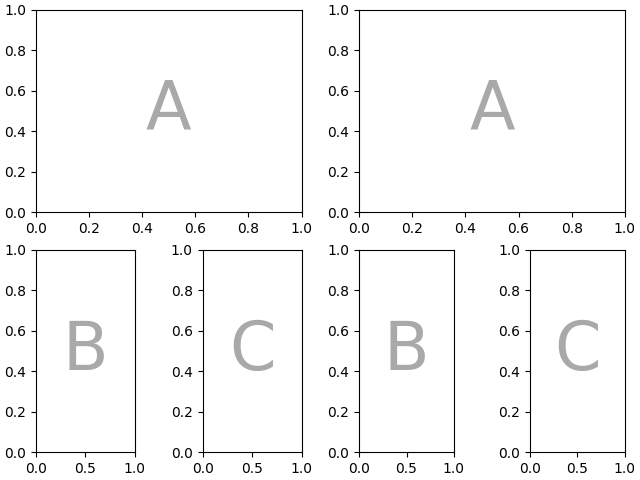
または、サブフィギュア機能を使用できます。
mosaic = """AA
            BC"""
fig = plt.figure(constrained_layout=True)
left, right = fig.subfigures(nrows=1, ncols=2)
axd = left.subplot_mosaic(mosaic)
identify_axes(axd)

axd = right.subplot_mosaic(mosaic)
identify_axes(axd)
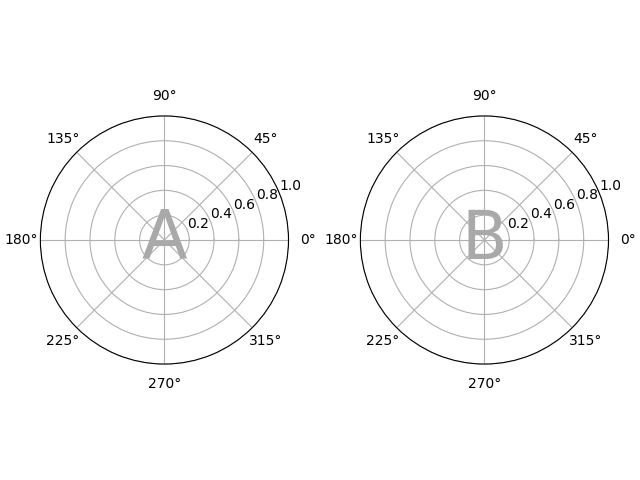
サブプロットの作成に使用される引数を渡すこともできます (これも と同じFigure.subplotsです)。
axd = plt.figure(constrained_layout=True).subplot_mosaic(
    "AB", subplot_kw={"projection": "polar"}
)
identify_axes(axd)
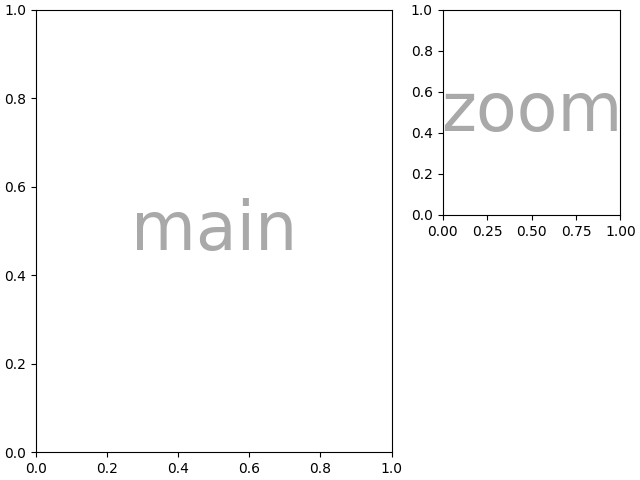
ネストされたリストの入力#
文字列の短縮形でできることはすべて、リストを渡すときにも実行できます (内部的に、文字列の短縮形をネストされたリストに変換します)。たとえば、スパン、空白、およびgridspec_kwを使用します。
axd = plt.figure(constrained_layout=True).subplot_mosaic(
    [
        ["main", "zoom"],
        ["main", "BLANK"],
    ],
    empty_sentinel="BLANK",
    width_ratios=[2, 1],
)
identify_axes(axd)
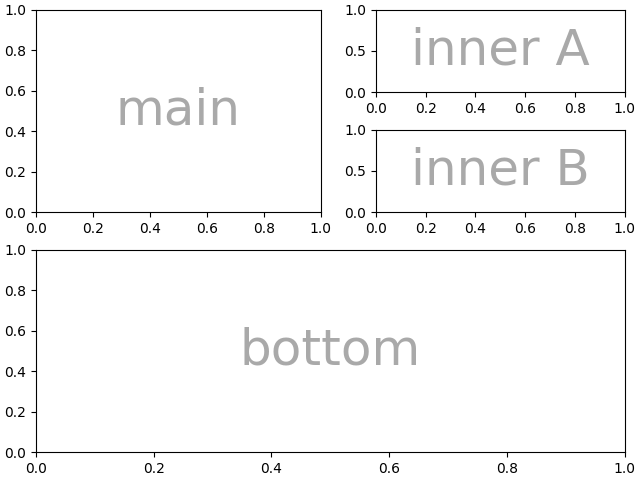
さらに、リスト入力を使用して、ネストされたモザイクを指定できます。内側のリストの要素は、ネストされたリストの別のセットにすることができます。
inner = [
    ["inner A"],
    ["inner B"],
]

outer_nested_mosaic = [
    ["main", inner],
    ["bottom", "bottom"],
]
axd = plt.figure(constrained_layout=True).subplot_mosaic(
    outer_nested_mosaic, empty_sentinel=None
)
identify_axes(axd, fontsize=36)
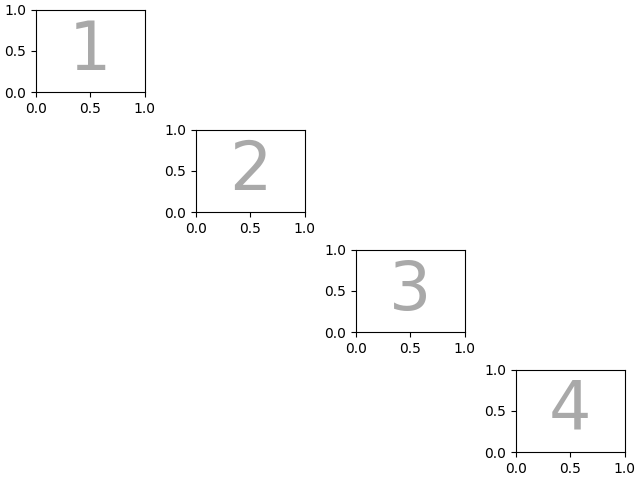
次のようなことを行うために、2D NumPy 配列を渡すこともできます。
スクリプトの合計実行時間: ( 0 分 9.170 秒)