ノート
完全なサンプルコードをダウンロードするには、ここをクリックしてください
#の原点と範囲imshow
imshow()データ空間の長方形の領域に画像 (( normとcmapに基づいて) カラーマップされる 2D 配列、またはそのまま使用される 3D RGB(A) 配列のいずれか) をレンダリングできます。最終的なレンダリングでのイメージの方向は、originおよびextent
キーワード引数 (および結果のAxesImageインスタンスの属性) と軸のデータ制限によって制御されます。
エクステントキーワード引数は、データ座標で指定された画像が塗りつぶすデータ座標の境界ボックスを制御します。originキーワード引数は、画像がその境界ボックスを塗りつぶす方法を制御し、最終的にレンダリングされた画像の向きも座標軸の制限の影響を受けます。 .(left, right, bottom, top)
ヒント
以下のコードのほとんどは、プロットにラベルと情報テキストを追加するために使用されます。記述された起点と範囲の効果は、すべてのコードの詳細に従う必要なく、プロットで見ることができます。
すぐに理解できるように、以下のコードの詳細をスキップして、結果の説明に直接進むことをお勧めします。
import numpy as np
import matplotlib.pyplot as plt
from matplotlib.gridspec import GridSpec


def index_to_coordinate(index, extent, origin):
    """Return the pixel center of an index."""
    left, right, bottom, top = extent

    hshift = 0.5 * np.sign(right - left)
    left, right = left + hshift, right - hshift
    vshift = 0.5 * np.sign(top - bottom)
    bottom, top = bottom + vshift, top - vshift

    if origin == 'upper':
        bottom, top = top, bottom

    return {
        "[0, 0]": (left, bottom),
        "[M', 0]": (left, top),
        "[0, N']": (right, bottom),
        "[M', N']": (right, top),
    }[index]


def get_index_label_pos(index, extent, origin, inverted_xindex):
    """
    Return the desired position and horizontal alignment of an index label.
    """
    if extent is None:
        extent = lookup_extent(origin)
    left, right, bottom, top = extent
    x, y = index_to_coordinate(index, extent, origin)

    is_x0 = index[-2:] == "0]"
    halign = 'left' if is_x0 ^ inverted_xindex else 'right'
    hshift = 0.5 * np.sign(left - right)
    x += hshift * (1 if is_x0 else -1)
    return x, y, halign


def get_color(index, data, cmap):
    """Return the data color of an index."""
    val = {
        "[0, 0]": data[0, 0],
        "[0, N']": data[0, -1],
        "[M', 0]": data[-1, 0],
        "[M', N']": data[-1, -1],
    }[index]
    return cmap(val / data.max())


def lookup_extent(origin):
    """Return extent for label positioning when not given explicitly."""
    if origin == 'lower':
        return (-0.5, 6.5, -0.5, 5.5)
    else:
        return (-0.5, 6.5, 5.5, -0.5)


def set_extent_None_text(ax):
    ax.text(3, 2.5, 'equals\nextent=None', size='large',
            ha='center', va='center', color='w')


def plot_imshow_with_labels(ax, data, extent, origin, xlim, ylim):
    """Actually run ``imshow()`` and add extent and index labels."""
    im = ax.imshow(data, origin=origin, extent=extent)

    # extent labels (left, right, bottom, top)
    left, right, bottom, top = im.get_extent()
    if xlim is None or top > bottom:
        upper_string, lower_string = 'top', 'bottom'
    else:
        upper_string, lower_string = 'bottom', 'top'
    if ylim is None or left < right:
        port_string, starboard_string = 'left', 'right'
        inverted_xindex = False
    else:
        port_string, starboard_string = 'right', 'left'
        inverted_xindex = True
    bbox_kwargs = {'fc': 'w', 'alpha': .75, 'boxstyle': "round4"}
    ann_kwargs = {'xycoords': 'axes fraction',
                  'textcoords': 'offset points',
                  'bbox': bbox_kwargs}
    ax.annotate(upper_string, xy=(.5, 1), xytext=(0, -1),
                ha='center', va='top', **ann_kwargs)
    ax.annotate(lower_string, xy=(.5, 0), xytext=(0, 1),
                ha='center', va='bottom', **ann_kwargs)
    ax.annotate(port_string, xy=(0, .5), xytext=(1, 0),
                ha='left', va='center', rotation=90,
                **ann_kwargs)
    ax.annotate(starboard_string, xy=(1, .5), xytext=(-1, 0),
                ha='right', va='center', rotation=-90,
                **ann_kwargs)
    ax.set_title('origin: {origin}'.format(origin=origin))

    # index labels
    for index in ["[0, 0]", "[0, N']", "[M', 0]", "[M', N']"]:
        tx, ty, halign = get_index_label_pos(index, extent, origin,
                                             inverted_xindex)
        facecolor = get_color(index, data, im.get_cmap())
        ax.text(tx, ty, index, color='white', ha=halign, va='center',
                bbox={'boxstyle': 'square', 'facecolor': facecolor})
    if xlim:
        ax.set_xlim(*xlim)
    if ylim:
        ax.set_ylim(*ylim)


def generate_imshow_demo_grid(extents, xlim=None, ylim=None):
    N = len(extents)
    fig = plt.figure(tight_layout=True)
    fig.set_size_inches(6, N * (11.25) / 5)
    gs = GridSpec(N, 5, figure=fig)

    columns = {'label': [fig.add_subplot(gs[j, 0]) for j in range(N)],
               'upper': [fig.add_subplot(gs[j, 1:3]) for j in range(N)],
               'lower': [fig.add_subplot(gs[j, 3:5]) for j in range(N)]}
    x, y = np.ogrid[0:6, 0:7]
    data = x + y

    for origin in ['upper', 'lower']:
        for ax, extent in zip(columns[origin], extents):
            plot_imshow_with_labels(ax, data, extent, origin, xlim, ylim)

    columns['label'][0].set_title('extent=')
    for ax, extent in zip(columns['label'], extents):
        if extent is None:
            text = 'None'
        else:
            left, right, bottom, top = extent
            text = (f'left: {left:0.1f}\nright: {right:0.1f}\n'
                    f'bottom: {bottom:0.1f}\ntop: {top:0.1f}\n')
        ax.text(1., .5, text, transform=ax.transAxes, ha='right', va='center')
        ax.axis('off')
    return columns
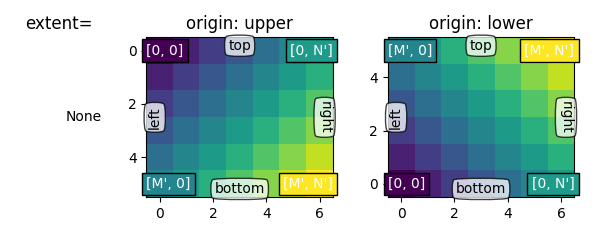
デフォルト範囲#
まずはデフォルトを見てみましょうextent=None
generate_imshow_demo_grid(extents=[None])
{'label': [<AxesSubplot: title={'center': 'extent='}>], 'upper': [<AxesSubplot: title={'center': 'origin: upper'}>], 'lower': [<AxesSubplot: title={'center': 'origin: lower'}>]}
一般に、形状 (M, N) の配列の場合、最初のインデックスは垂直に沿って実行され、2 番目のインデックスは水平に沿って実行されます。ピクセルの中心は、0 から
水平方向および 0 から垂直方向の整数位置にあります。
originは、データがバウンディング ボックスにどのように埋められるかを決定します。N' = N - 1M' = M - 1
の場合origin='lower':
[0, 0] は (左、下)
[M', 0] は (左、上)
[0, N'] は (右、下) にあります
[M', N'] は (右、上)
origin='upper'縦軸の方向と塗りつぶしを反転します。
[0, 0] は (左、上)
[M', 0] は (左、下)
[0, N'] は (右、上)
[M', N'] は (右、下)
要約すると、[0, 0] インデックスの位置と範囲はoriginの影響を受けます。
元 |
[0, 0] 位置 |
範囲 |
|---|---|---|
アッパー |
左上 |
|
低い |
左下の |
|
originのデフォルト値はrcParams["image.origin"](default: 'upper')によって設定されます。これ'upper'は、数学およびコンピュータ グラフィックス イメージのインデックス付け規則の行列インデックス付け規則に一致するようにデフォルト設定されています。
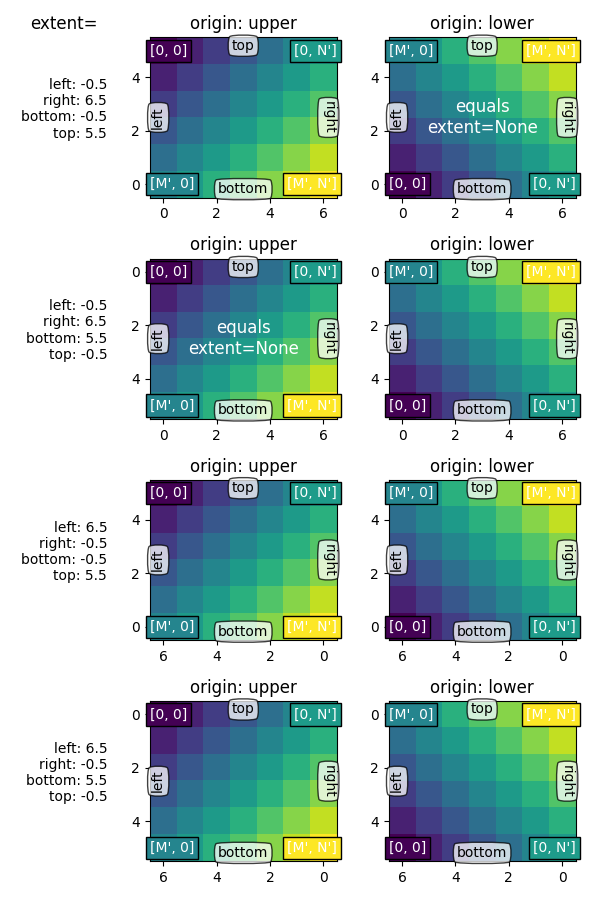
明示範囲#
範囲を設定することで、画像領域の座標を定義します。基になる画像データは、その領域を埋めるために補間/再サンプリングされます。
軸がオートスケールに設定されている場合、軸のビュー制限は範囲に一致するように設定され、 によって設定された座標が軸の左下にあることが保証され
ます! ただし、これにより軸が反転する可能性があるため、「自然な」方向に増加しません。(left, bottom)
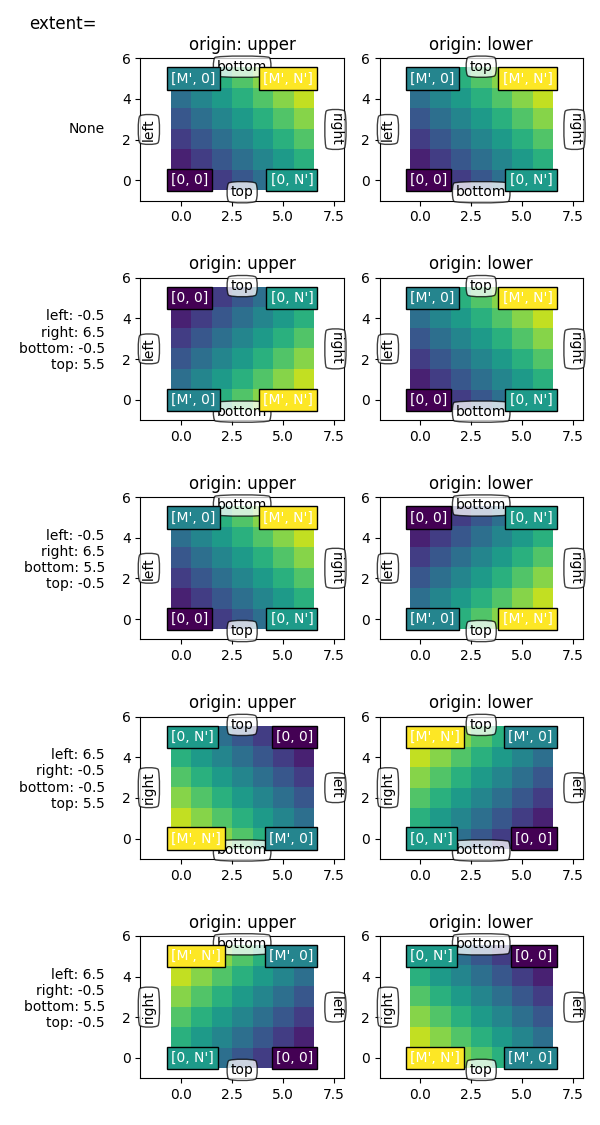
明示的な範囲と軸の制限#
set_xlim/
を明示的に設定して軸の制限を修正すると、軸set_ylimの特定のサイズと方向が強制されます。これにより、画像の「左右」および「上下」の感覚を画面上の方向から切り離すことができます。
以下の例では、範囲よりもわずかに大きい範囲を選択しています (軸内の白い領域に注意してください)。
前の例のようにエクステントを維持しますが、座標 (0, 0) は明示的に左下に配置され、値は (ビューアーの視点から) 右上に増加します。次のことがわかります。
座標は画像を固定し、データ空間内のポイントに向かってボックスを埋めます。
(left, bottom)(right, top)最初の列は常に「左」に最も近いです。
originは、最初の行が 'top' または 'bottom' に最も近いかどうかを制御します。
画像はいずれかの方向に反転する場合があります。
画像の「左右」および「上下」の感覚は、画面上の向きから切り離される場合があります。
スクリプトの合計実行時間: ( 0 分 4.816 秒)